I have had a few folks ask recently if the new 2020 census data is out. Most of it has been released at this point, and this coincides with the multiple questions about how many people have moved to our area.
I wish I had more precise information to share, but I will share with you what is out there and you can draw your own conclusions about our current population and workforce situation.
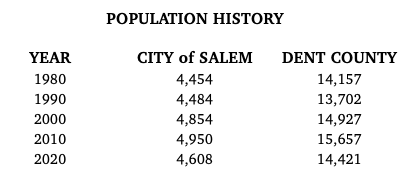
Dent County's 2020 population is 14,421, and the City of Salem's 2020 population is 4,608.
As you can see by the accompanying chart, these numbers are showing a decrease in population for both the county and city and this is the ongoing narrative for the past several years related to rural America.
But this doesn't jive with what we are all seeing due to an influx of newcomers to our area that began after the onset of COVID-19.
The census numbers are intended to be a snapshot of the population on April 1, 2020, to the best of the Census Bureau's ability to capture it. However, the Census Bureau released in December, 2021, updated estimate numbers on population between July 1, 2020 and July 1, 2021.
"The U.S. Census Bureau recently released state population estimates for 2021. Missouri gained approximately 13,700 new residents, growing by 0.2 percent compared to 2020 annual estimates,” the release stated. “Texas had the largest gain in population adding 310,288 new residents, followed by Florida and Arizona. New York saw the largest decrease in population with 319,020 fewer residents, followed by California and Illinois."
Unfortunately, the estimate numbers showing a growth in population for Missouri are not available at the county level.
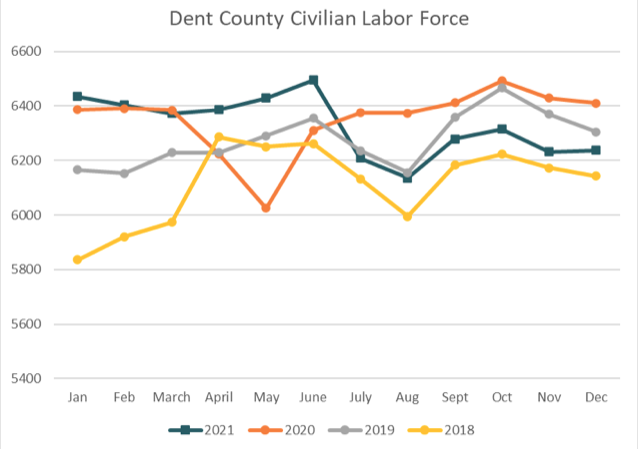
A few months back , prior to the census numbers being released, I put together some information about the growth in the county-wide labor force as an indication of potential growth in population at the request of a local real estate office. I will share a graph here, but I caution about reading too much into it at this point. The ramping up of unemployment benefits during the early stages of COVID in 2020 are reflected in the growing number of people in the workforce in this graph, and then later this number drastically drops, when state level benefits are halted in June 2021.
Keep in mind, this is not population, but labor force. This is the number of people working or looking for work, and there are many legitimate reasons a person may not be part of this labor force. Examples are retired, disabled, student, individual staying at home to care for family members, etc.
In the accompanying graph, look at each line by itself, the first yellow line is 2018 and you will notice for all but three months of that year it is the smallest number in the labor force.
Next is 2019 or the grey line and for all but one month it shows a larger labor force than the year before.
In 2020, the orange line starts in January with a much larger labor force than the previous two years and then drops sharply as COVID hits and businesses are shut down, reaching 2020s lowest point in May and then rebounding as various assistance programs come in to play, both for individuals and businesses, and businesses begin to reopen.
Finally, 2021 starts strong, dips slightly then begins growing steadily until it drops sharply after the state unemployment benefits end in June.
While the labor force numbers are beginning to recover, you will notice they more closely reflect the numbers from three years prior, our smallest labor force size of the past four years.